.png?width=200&height=150&name=campspotlogo2019%20(1).png)
Performance Summary
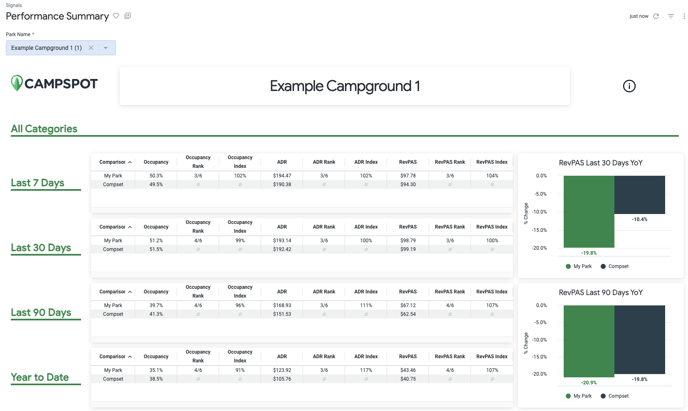
The Performance Summary provides a breakdown of occupancy, average daily rate (ADR), and revenue per available site (RevPAS) over multiple trailing time periods for your park and comp set. This dashboard helps you quickly identify how your park is performing across all campsite categories and the individual categories of RV, tent and lodging.
Year-over-year (YoY) RevPAS shows the percent change from the equivalent dates last year with breakdowns for each campsite category. A negative percent change indicates lower RevPAS compared to last year, and positive percent change indicates higher RevPAS. Comparing your park’s change in RevPAS to your comp set will tell you if RevPAS is increasing or decreasing at a faster or slower rate than your competitors.
Key Performance Metrics and Breakdowns
- Campsite category:
- All Categories
- RV Sites
- Tent Sites
- Lodging Sites
- Time:
- Last 7 days
- Last 30 days
- Last 90 days
- Year to date
See an example of the dashboard below: