.png?width=200&height=150&name=campspotlogo2019%20(1).png)
Monthly Performance
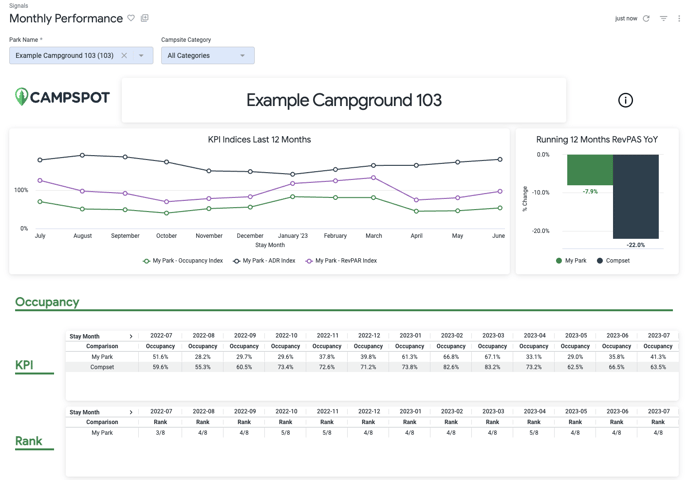
The Monthly Performance report breaks down occupancy, average daily rate (ADR) and revenue per available site (RevPAS) month-by-month. Year-over-year percent change compares the last 365 days to the same 365 days from the previous year. The campsite category filter will filter all performance metrics to only include data for the selected campsite categories.
The KPI Indices Last 12 Months graph shows your park’s performance indices over the last 12 months. An index of 100% means you have matched your compset’s numbers. If your numbers are above 100, then you are outpacing your compset. You can also observe the last 12 months RevPAS % change for your property and for your compset.
The bottom section breaks down Occupancy, ADR and RevPAS in 3 ways:
- KPI: Performance numbers for both your property and your compset.
- Rank: Your property’s average rank that month in your compset. If your property is ranked 1, it means you have outperformed everyone in your compset.
- YoY: This section shows the percent change YoY for your property and compset, calculated as follow:
(This Year - Last Year) / Last Year
See an example of the dashboard below: