.png?width=200&height=150&name=campspotlogo2019%20(1).png)
Day of Week Performance
The Day of Week Performance report breaks down occupancy, average daily rate (ADR), and revenue per available site (RevPAS) by day of the week. This report can be filtered by a range of trailing stay dates and campsite categories.
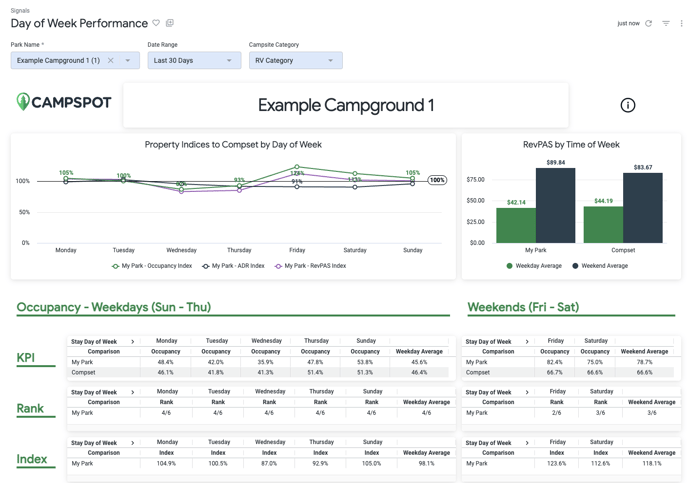
The Property Indices to Compset by Day of Week graph shows your park’s performance indices over the last 12 months. An index of 100% means you have matched your compset’s numbers. If your numbers are above 100, then you are outpacing your compset. You can also observe the average RevPAS by time of week (Weekday: Sunday-Thursday and Weekend: Friday-Saturday) for both your property and compset.
The bottom section breaks down Occupancy, ADR and RevPAS by both Weekday and Weekend in 3 ways:
- KPI: Performance numbers for both your property and your compset.
- Rank: Your property’s average rank that month in your compset. If your property is ranked 1, it means you have outperformed everyone in your compset.
- Index: An index of 100% means your property is doing the same average as your compset.
See an example of the dashboard below: