.png?width=200&height=150&name=campspotlogo2019%20(1).png)
Business Mix Analysis
This dashboard provides information about the nature of your property’s and your compset’s business mix. We deep dive into different reservation and revenue segmentation to better understand the business reality of your park and your compset. This can help identify opportunities with transient versus extended stays, group reservations, promo code utilization, lock site fees and more.
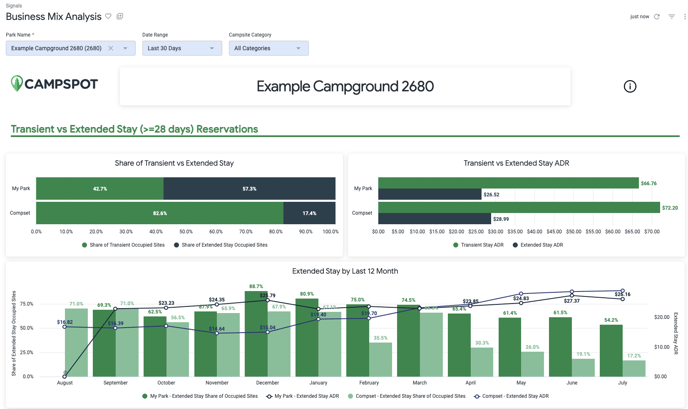
Transient versus Extended Stay Reservations
In this section, you will learn more about the division between Transient (less than 28 days) and Extended Stay (28 days or more) reservations. Regardless of overall occupancy, we show what percentage of your reservations were dedicated to each segmentation.
In the Last 12 Months graphs, you may compare your property’s share of occupied sites and ADR in both segmentation against your compset.
Group Reservations
See if your park is getting its fair share of group bookings against your compset. You may also explore the difference between each Campsite Category and see if some are more popular than others amongst campers. This could help establish a marketing strategy around hosting groups.
Locked Reservations
Compare the share of Locked reservations at your property versus your compset. By using these statistics you can estimate the impact increasing or decreasing your lock site fees would have on your locked site conversion.
Promo Code Reservations
This section shows the utilization of Promo Code at your property against your compset
Add-ons
Add-ons are compared in this section in 2 different ways. First we show the share of add-ons that were booked online versus offline. Then we show the average add-on sold per occupied site. This gives insights on how well your add-ons are converting against your compset.
Other
- Average Fees per Reservation: This includes Pet Fees, Occupancy Fees, Service Fees and Cancellation Fees. You can compare if your fees are in-line or higher than your competitors and how they can potentially impact your overall revenue and customer satisfaction.
- Average POS Revenue per Reservation: We take the sum of Point of Sale Revenue divided by the number of occupied sites. This can provide insights in how campers are spending at your property.
Reservation Trends
Here you will find information on your property and your compset’s guest booking behavior.
- Occupancy Share by Category: of all the occupied sites, what percentage were for RV, Tent or Lodging Sites.
- Average Booking Window: The booking window is calculated in number of days between the booking date and the start of a reservation.
- Average Length of Stay: The length of stay is calculated in number of days between the start and end date of a reservation (the average number of nights a guest will stay at a property).
See an example of the dashboard below: