.png?width=200&height=150&name=campspotlogo2019%20(1).png)
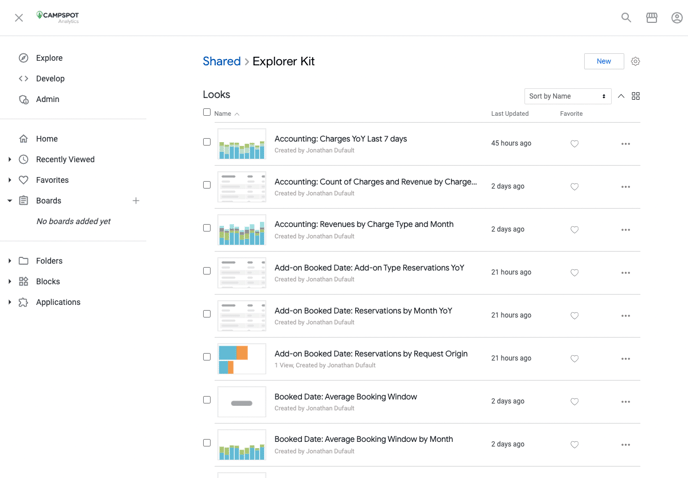
The main goal of the Explorer Kit is to offer a library of content and facilitate the creation of relevant reports and visualizations. The Explores within Campspot Analytics might be confusing at first and require some knowledge to get started. The Explorer Kit library provides many popular reports that can be handpicked and added to any of your custom dashboards.
 Navigating to the Explorer Kit
The Explorer Kit Folder is located under the Shared Folder, next to your Organization’s personal folder.
 How to Create a Dashboard
There are 2 ways you can start building a dashboard; from scratch or from a pre-defined report.
From Scratch (Not recommended for new users)
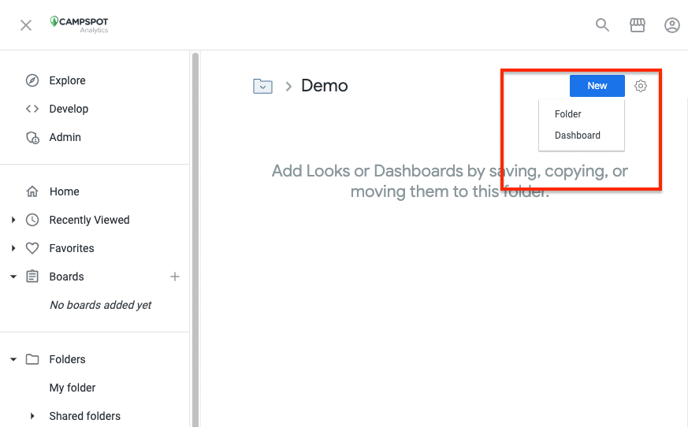
Navigate to the Shared Folder section, then select your Organization name.
-
In this folder, click on the New button and select Dashboard
-
Enter a name and select Create Dashboard
This method will result in a blank canvas to start from.
From a pre-made report
-
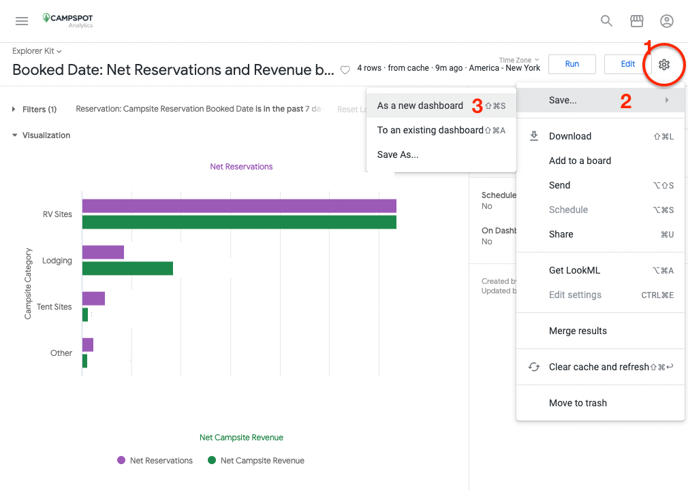
From the Explorer Kit folder, select the base report you want to use to start creating adashboard (you will be able to add more reports to the dashboard later).
For this example we are using the Booked Date: Net Reservations and Revenue by Campsite Category report. -
When viewing the report, click on the cogwheel menu and select the Save… As a new dashboard option.

-
Enter a name for your dashboard, and save it under the Shared > Your_organization_name folder if you wish to be able to share it with people within your organization. If this is a private dashboard, save it in the “My Folder” Option. In this example we are saving the Recent Booking Trends Dashboard to the Campspot > Demo folder.
-
You can now access your new dashboard, along with basic filtering options applied.
This method will add a tile in your base dashboard.
 Adding Tiles to your Dashboard
Now that we have a base dashboard to work with we can add more content to be seen side by side with our first Tile.
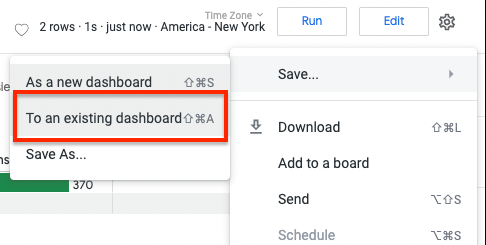
From here, you can repeat the steps from the Pre-made report section above. Navigate to the Explorer Kit Folder and select the report you want to add to your new dashboard. In the Look Report, click on the cogwheel menu, then the save sub-menu. This time, instead of saving a report to a new dashboard, you may select the save to an existing dashboard option. In the new screen, navigate to the folder you saved your dashboard to, select it, and click on the Save to Dashboard button. This will create a 2nd visualization on our new dashboard.
For this example we are using the Booked Date: Net Reservations and Revenue by Seasonal/Transient report.
If you do not see the new Report Tile, Refresh your dashboard browser page and follow the steps above to access editing mode.
Editing your Dashboard
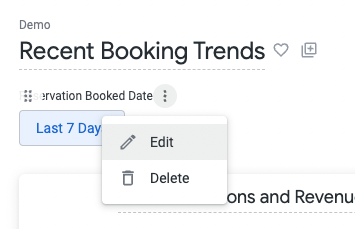
Open your new dashboard, and select the three-dots menu in the top right corner and select the Edit Dashboard option. You are now in editing mode. 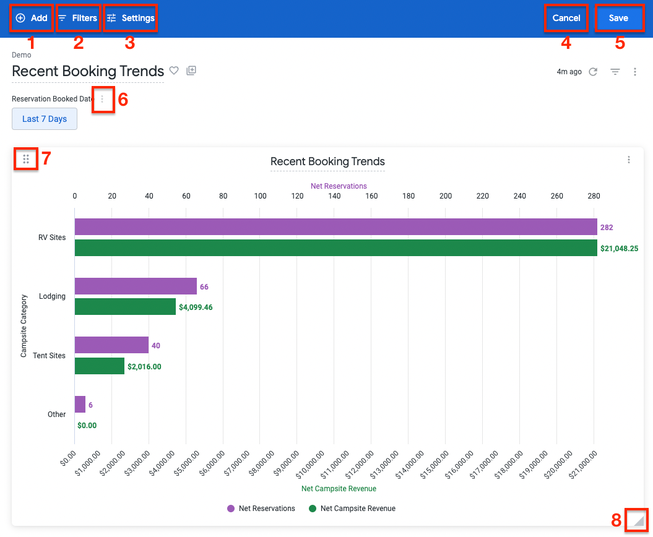
-
Add: A sub-menu will appear giving the option to add a visualization (which will need to be built from the ground up), Text (free text input) or a button (that can link off to another site/view).
-
Filters: Allows the user to add a dashboard level filter. For example, if you manage multiple parks, you might want to add a Park Name filter to the dashboard so you can isolate data better (more on filters below).
-
Settings: Dashboard level settings such as auto-refresh or default time-zone.
-
Cancel: Clicking the cancel button will not save any changes made to the dashboard.
-
Save: Don’t forget to save once you are done with your modifications.
-
Three-dot filter menu: Allows to modify default filter values and on which report (Tile) to apply the filter (more on filters below).
-
Six-dot: drag this icon to move the Tile around.
-
Corner Triangle: drag to resize the tile to your liking.
Don't forget to click the Save button once you are happy with your changes.
 Organizing and Editing Tiles
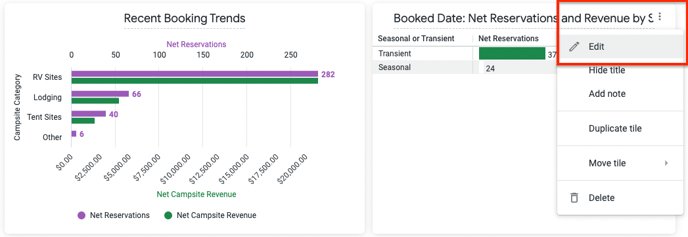
Resize the 2 Tiles on your dashboard and drag them side by side. We can now edit the way the visualization is displayed. Click on the three-dot menu in the upper-right corner of one tile and select Edit.
Editing the Tile
-
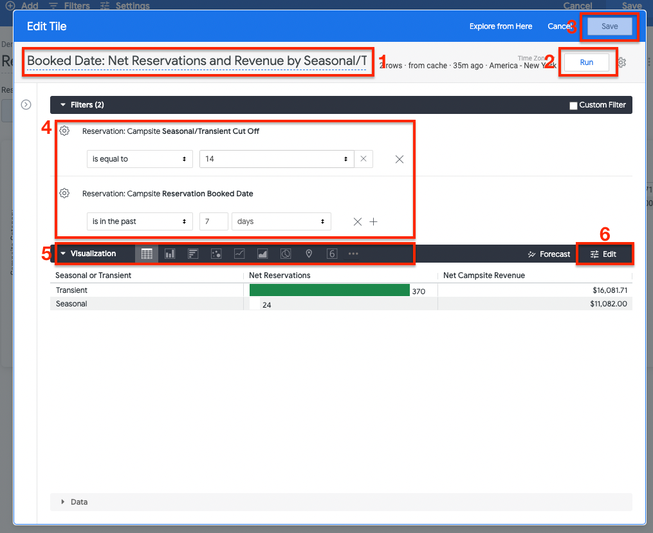
You can change the title of the Tile which will be reflected on your dashboard.
-
Whenever you make changes, you will need to run the dashboard to preview the results.
-
Click on the Save button to apply any modifications you made to the Tile. The button will be greyed-out until any changes are made.
-
Filter section: In this example, this Tile has 2 filters:
-
Seasonal/Transient Cut Off: establishes the number of days that separates Seasonal stays from Transient (14 days in this example, but you may edit this filter to any number. Number is greater or equal than).
-
Reservation: Campsite Booked Date: filter to narrow down reservations that were booked during the last X period or date range.
-
-
The visualization bar provides different ways to visualize the data. In this example, we are seeing a table of data not unlike Excel. You can modify the visualization to show a bar or column graph
-
The Edit button offers ways to edit the elements within a visualization. This section is dynamic based on the type of visualization selected. You can change column names, colors, spacing, axes, add conditional formatting, etc.
Important Note on Filters
-
Seasonal/Transient filter was not on the main dashboard. The filter is still applied to that one Tile and will affect only the content within this report.
-
The Reservation Booked Date filter is on our dashboard. This means that if a different value is selected on the dashboard (for example, is in the past 28 days then this will overwrite the filter within this Tile.
Any filters on the dashboard will take precedence over the one that is within a Tile.
Finalizing Visualizations
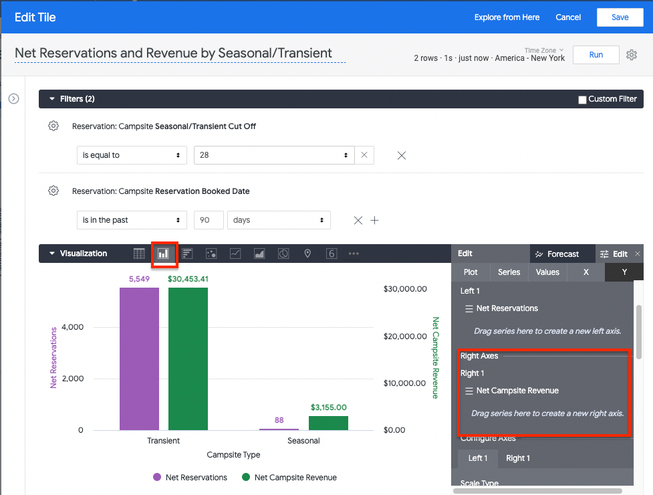
For this example, we have selected a Column visualization type and updated the Seasonal cut off day to 28. We have also edited the Y axis to have the Revenue and Reservations on different axes by simply dragging and dropping the dimensions into the Axes section. We also have update the title.
 Understanding Filters
Staying in dashboard editing mode, you can modify dashboard-level filters and how they interact with each Tile. Next to the Reservation Booked Date filter, click the three-dot icon and select Edit.
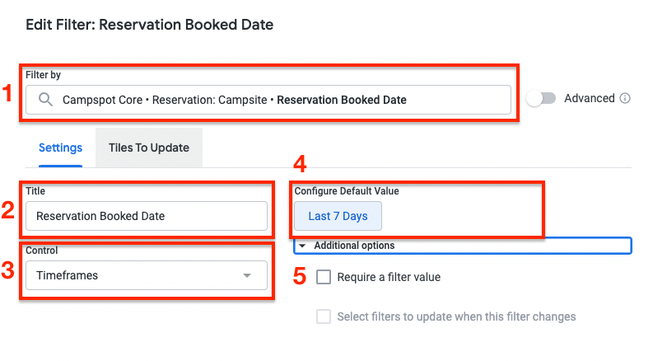
Editing a Filter - Settings
-
The Filter by dropdown contains all the possible fields you can reference on the data model. This is pre-populated in our case because the filter was implemented from the first report we transformed into a dashboard.
-
The Title section will change the name of the filter on the dashboard.
-
The Control section offers different ways to filter the data and will be dynamic based on the field-type of the filter. For dates there are options like Single Date, Timeframes or Date Range. For text, there are options such as Single Value, Dropdown, Checkboxes, etc. For numbers, Single Value, Slider, Range, etc.
-
The default value will also be dynamic based on the field-type.
-
Additional options: can add a mandatory filter value to be able to run the dashboard.
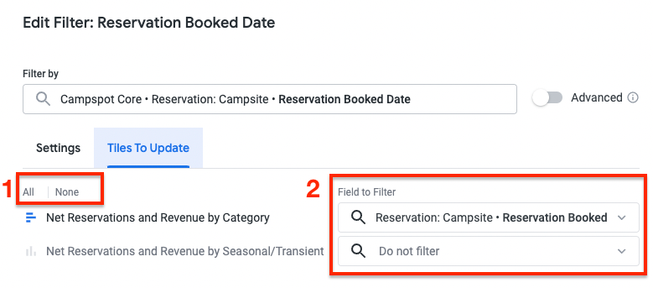
Editing a Filter - Tiles to Update
This section is crucial, as it controls which Tiles are being updated by the current filter. Omitting to update this section can result in Tiles not displaying the correct information.
-
All | None: By clicking on All, the filter will apply to each Tile on the same dimension that is defined in the Filter by section at the top. This is the default behavior in most cases.
-
Field to Filter: Each dropdown is associated with the Tile to its left (which is why it’s always a good idea to give your Tiles meaningful titles).
As explained earlier, we will not add the Transient/Seasonal Cut Off filter on the main dashboard as this filter does not need to be updated beyond the one tile that is leveraging this feature. The filter that is applied at the Tile level will stay applied as long as it is not overwritten by a dashboard level filter.
Additional Filtering Complexity
It is possible to override the dimension in the Field to Filter with another field. For example, Campsites and Add-on reservations have 2 different "Booked Date" dimensions. If our dashboard had a Tile with Add-on reservation information, filtering on the Campsite Booked Date would return nothing. In this case, you may use the drop down to manually select the Reservation: Add-on Booked Date on the Tile that is referencing Add-on data, and select the Reservation: Campsite Booked Date on the Tile that is referencing Campsite data.
Doing so allows you to only have 1 date filter on your dashboard for the user to update, instead of having a Campsite Booked Date filter that doesn’t update the Add-on Reservation Information Tile and an Add-on Booked Date filter that doesn’t update a Campsite Reservation Information Tile.
Adding a Filter
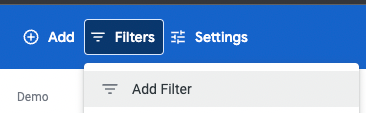
For this dashboard, we want to add a second filter that will allow to narrow the data by where the reservations came from (Request Origin). To add a second filter, select the Filters > Add Filter option from the dashboard editing-mode.
You can use the text box to search for the dimension you are interested in adding (in this case, Reservation Request Origin). As you will notice, we have 2 options: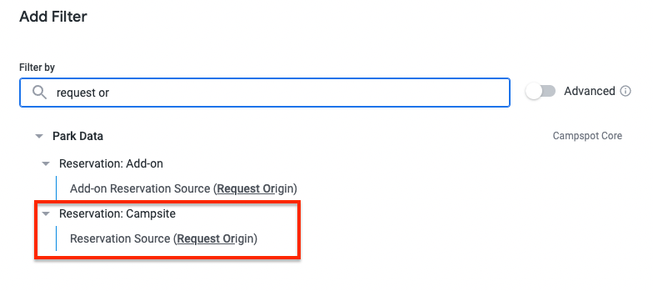
-
Reservation: Add-on
Add-on Reservation Source (Request Origin) -
Reservation: Campsite
Reservation Source (Request Origin)
In our dashboard, we are visualizing only CampsiteReservation data so far, so we want to select the Campsite dimension. Once the dimension has been selected, this screen will show. As we did previously, you may update how the filter will work.
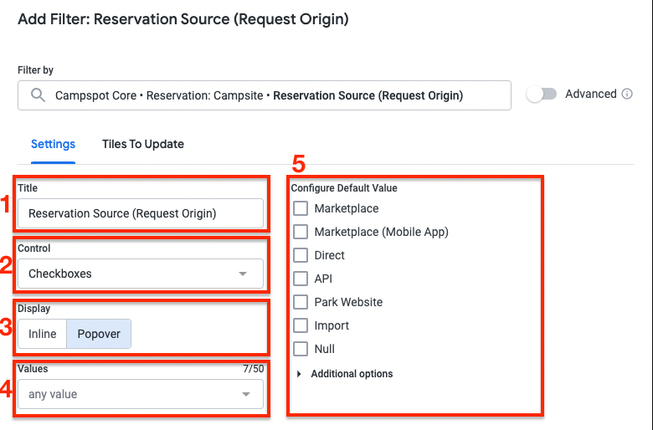
Settings Section
-
Title: Filter title displayed on the dashboard
-
Control: How the filter will be presented (checkboxes, buttons, tag list, etc)
-
Display: Inline (left to right) or Popover (top to bottom)
-
Values: If we want to limit the values available to selection on the dashboard filter.
-
Default Value: Which options are selected by default when a user opens a dashboard.
Tiles to Update Section
-
We want to update all the Tiles with this new Request Origin Filter by clicking the All button.
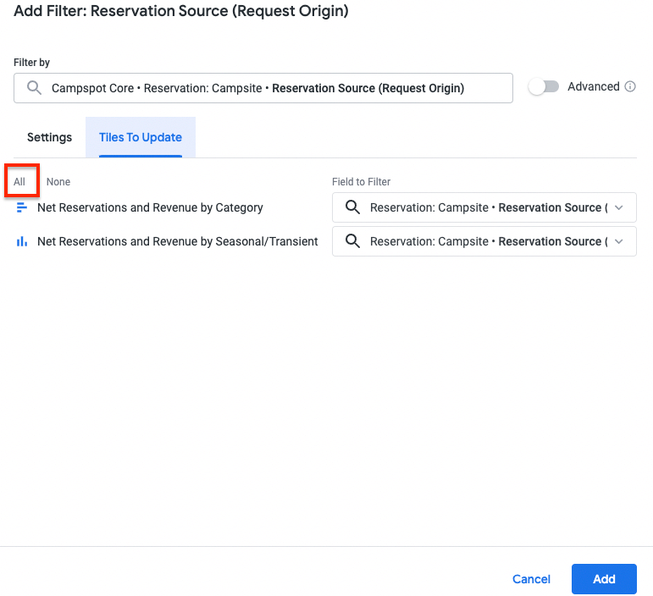
Don’t forget to click the save button in the upper right corner of your dashboard! Exiting the page without saving will result in losing any changes you have made.
Finally, press the Update button to refresh the data with your new filters applied.
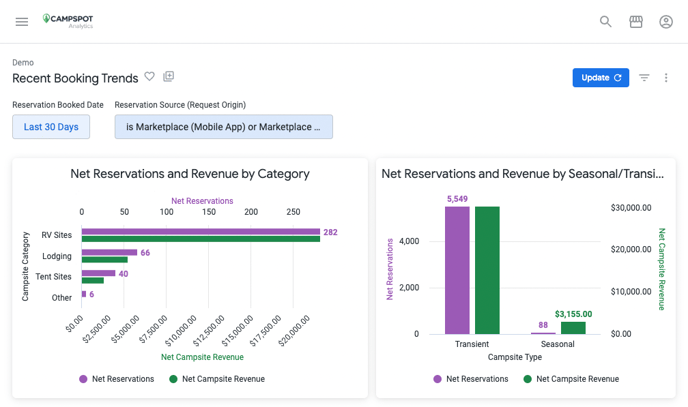
 Final Look
Congratulations your custom dashboard is complete!
How do I get access to a Campspot Analytics Explorer License?
This advanced service is available for a fee. To learn more information, including activating, cost and other information about the Campspot Analytics platform, complete the form found here.