.png?width=200&height=150&name=campspotlogo2019%20(1).png)
Signals
Signals gives campgrounds access to competitive benchmarking reports, providing valuable insights that can help them make data-driven decisions and stay ahead of the competition.
We have aggregated performance metrics from thousands of parks across North America to provide you a way to compare your park’s performance against a competitive set (comp set) displayed in dashboards. These performance metrics determine your parks’ rank within your comp set using indexes to calculate your market share.
The performance metrics available via the Signals dashboards include:
| Term | Explanation |
| Average Daily Rate (ADR) | This is the sum of your campsite revenue divided by your number of occupied sites. |
| Occupancy Rate (OR) | Percent of your sites that were occupied |
| Revenue per Available Site (RevPAS) | A common success metric that draws balance between your sell price and your occupancy level. Calculated by multiplying your ADR with your occupancy percentage. |
You will be able to access up to a year’s worth of historical benchmarking data for free.
All Signals competitor data is anonymized and averaged: users are not able to identify individual parks in their competitive set.
What is Rank?
Rank tells you the position of your property within the competitive set. If there are 5 parks in your compset and your rank is 5/5 then you are last in your comp set, and if your rank is 1, you are first in your comp set.
What are Indexes?
Rank is determined by indexes. Indexes calculate your share of occupancy and rate compared to your competitors. An index of 100 means you broke even with your competitors. If higher than 100, you achieved a greater share than your competitors. If less than 100, you underperformed in comparison to your competitors.
Your index for occupancy, average daily rate (ADR), and RevPAS (revenue per available site) will vary depending on factors related to your business strategy and performance. For example, you could be outperforming competitors in ADR and underperforming in occupancy.
Index is calculated using:
(My KPI / My Compset KPI) * 100
Signals Dashboards
Below are screenshots of Signals dashboards for an example campground. Your parks’ performance will vary.
For more information on specific dashboards, click on the dashboard name above the screenshot to learn more.
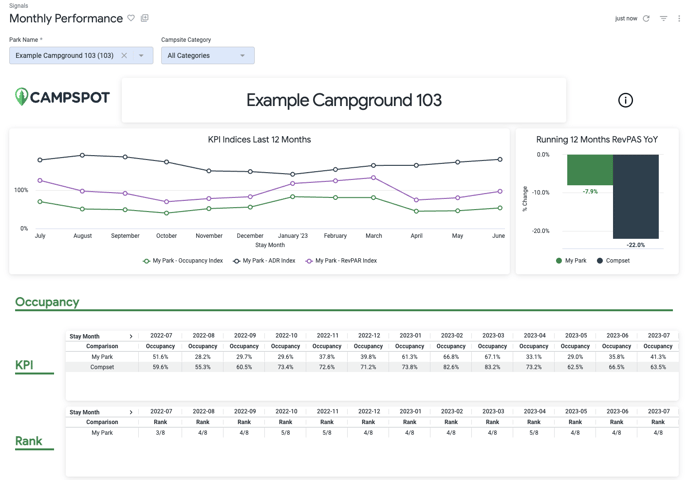
Monthly Performance
The Monthly Performance report breaks down occupancy, average daily rate (ADR) and revenue per available site (RevPAS) month-by-month.
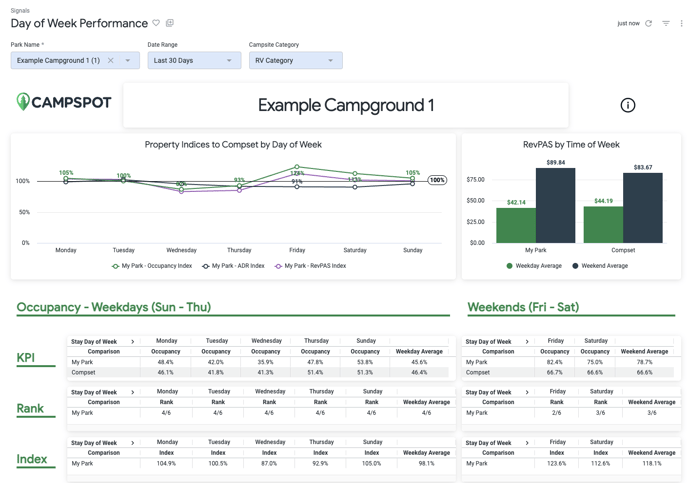
Day of Week Performance
The Day of Week Performance report breaks down occupancy, average daily rate (ADR), and revenue per available site (RevPAS) by day of the week.
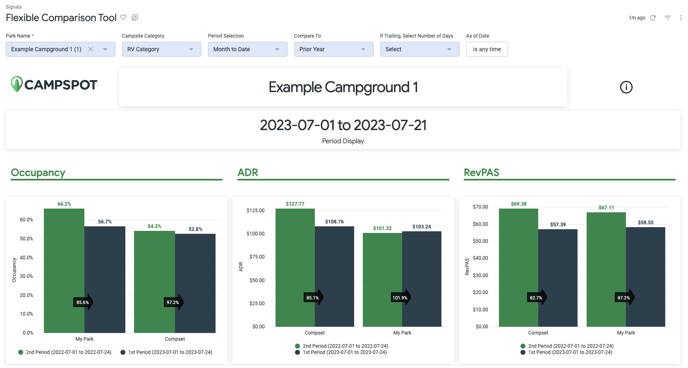
Flexible Comparison Tool
The flexible comparison gives you freedom to explore custom trailing periods to compare your park’s performance metrics.
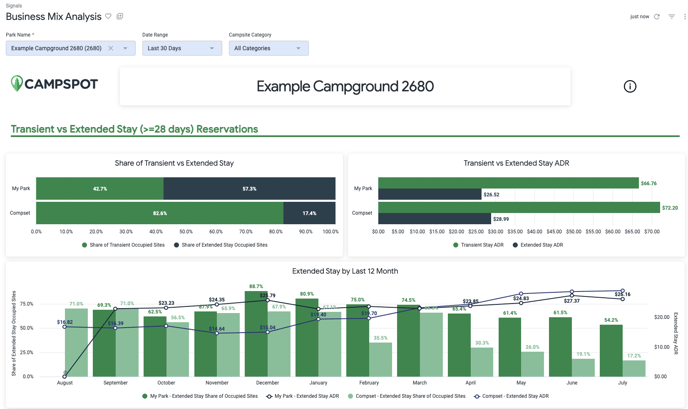
Business Mix Analysis
This dashboard provides information about the nature of your property’s and your compset’s business mix including metrics on:
- Transient vs Extended Stay Reservations
- Group Reservations
- Promo Code Utilization
- Lock Site Fees
- and more.
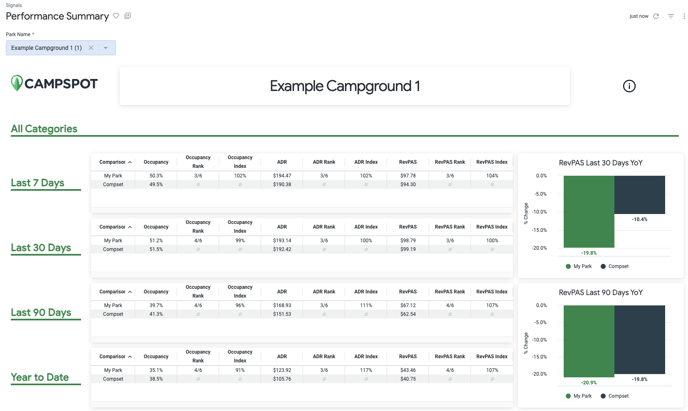
Performance Summary
The Performance Summary provides a breakdown of occupancy, average daily rate (ADR), and revenue per available site (RevPAS) over multiple trailing time periods for your park and comp set.
FAQ
How is my competitive set determined?
The Signals competitive set consists of a minimum of five comparable parks based on proximity, amenity match, size and production. Some of the amenities considered in the amenity match include things like: waterfront, waterpark, beach, pool, restaurant, internet access, general store, playground, bathrooms, showers, and dump station. Seasonal-transient mix and whether the park has matching site categories (tent, RV and lodging) are also taken into account.
Will my competitors be able to see my parks’ performance?
All data provided in the competitor analysis is anonymized. Even when customizing your competitive set, you will not be able to select specific parks.