.png?width=200&height=150&name=campspotlogo2019%20(1).png)
Summary:
Setting monthly goals is a critical part of running a successful park, but tracking those goals against real-time data often requires manual spreadsheets and hours of cross-referencing. Performance Planner eliminates this friction by allowing you to upload your revenue and unit targets directly into the Campspot ecosystem, providing a unified view of your park's progress against its potential.
The Performance Planner is a powerful tool that allows you to upload monthly revenue and unit sales targets for specific site categories, types, and POS locations. By defining these targets within the Performance Planner interface, you can transform your Analytics dashboards from historical reports into forward-looking strategic tools. Once your targets are uploaded, they appear alongside actual performance and "Same Time Last Year" metrics, giving you instant clarity on whether you are hitting your marks.
Uses:
- Targeted Growth: Set specific monthly revenue goals for different site categories (e.g., Nightly, Seasonal) or add-ons like golf cart rentals
- Occupancy Planning: Input targets for "Units Sold" to monitor and drive occupancy rates across specific site types.
- Gap Analysis: Compare real-time performance against projected targets to identify which areas of your business require marketing or pricing adjustments.
- Historical Benchmarking: View current targets against last year’s final results to ensure year-over-year growth.
- Multi-Park Visibility: For organizations managing multiple properties, use the Portfolio view to compare revenue attainment across all parks side by side
Get Started:
Step 1: Request Activation
- Follow this link to sign up by providing your park's name & ID number (or Organization's name and Org ID), and also the email addresses of up to 4 contacts who can manage the targets
Note: The Performance Planner is included for all parks on the Growth Package, and available at $10/month for each property not on the Growth Package.
Step 2: Access the Workspace:
- Once notified via email that your environment is ready, log into the Performance Planner interface provided in the email
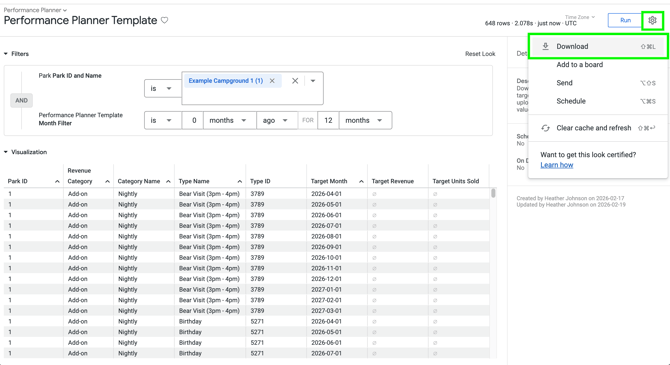
Step 3: Download the Template:
-
Navigate to the Performance Planner Template in Campspot Analytics,
- Filter by your Park ID and the Date Range you wish to set targets for.
- Select Download from the gear icon, and choose Excel Spreadsheet (.xlsx) or CSV
How TO: Add and Upload Targets
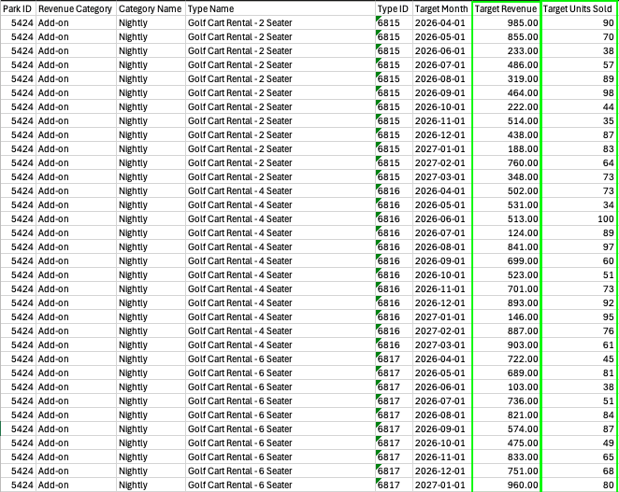
Step 1: Prepare the Data
- Open your downloaded template and enter your Target Revenue and Target Units Sold for each row.
- Note: Do not remove the Type ID, as this is required to map data back to your Analytics models.
- You may delete rows that do not require a target
Step 2: Import to Performance Planner:
- Log into Performance Planner and select the dropdown next to Add Row, then click Import Data.
Step 3: Validate and Confirm:
- Follow the steps to validate your rows. When prompted, enter a Change Message (e.g., "Q3 2026 Targets") to track this update in the History tab
Step 4: Monitor the Load:
- Check the Monitoring tab to confirm the upload shows a successful status before making additional edits or importing again.
Step 5: Review in Campspot Analytics:
- Visit the Performance Planner Dashboard in Campspot Analytics to see your revenue targets visualized against actual performance data.
Making Quick Edits:
If you need to adjust a single target, you do not need to re-import a spreadsheet:- Click directly into a cell within the Performance Planner interface to edit the value.
- The cell will turn yellow to indicate an edited value.
- Click Load Updates and provide a change message to save your edits.
Revenue Categories:
All metrics are broken down across four revenue categories:| Category | What it Covers |
| Campsite | Revenue and units from campsite reservations, net of campsite discounts. |
| Add-on | Revenue and units from add-on reservations (e.g., firewood, golf cart rentals), net of add-on discounts. |
| Point of Sale | Revenue from POS transactions and POS online store add-ons |
| Fees | Miscellaneous fees including cancellation, lock site, occupancy, OTA, pet fees, and reservation surcharges, net of applicable discounts. |
Key Metrics:
The Actual vs Targets Dashboard displays four parallel metrics —where you stood at this same point last year, where you ended up last year in total, where you stand today, and where you planned to be — so you can make informed, forward-looking decisions.| Metric | What it Shows |
| Same Time Last Year Revenue / Units Sold | Revenue or units that had been earned by this same point last year — only bookings made on or before the equivalent date 52 weeks ago. This is your apples-to-apples pace comparison: how did last year look at exactly this stage? |
| Last Year Final Revenue/Units Sold | Total revenue or units achieved across all of last year, including bookings made at any point in the season. This is the complete picture of what last year delivered and a useful full-year benchmark. |
| Current Revenue / Units Sold | Your current year’s revenue to date, plus all reservations already on the books for future months this year. This is your real-time running total for the year. |
| Target Revenue /Units Sold | Miscellaneous fees including cancellation, lock site, occupancy, OTA, pet fees, and reservation surcharges, net of applicable discounts. |
Same Time Last Year Revenue / Units Sold
- Net revenue (or units sold) that had been earned by this same point last year — meaning, only bookings that were made on or before the equivalent date 52 weeks ago.
Why it matters: This is your apples-to-apples comparison. It answers: "At this exact point in the prior season, how much had we already accumulated?" It strips out any bookings made after the equivalent date last year, so you're not comparing your current pace against last year's final numbers — you're comparing your current pace against last year's pace at the same stage of the booking cycle.
Example: Today is May 5, 2025. This metric shows revenue from bookings that were both (a) applying to dates in 2024, and (b) made on or before ~May 5, 2024. A June 2024 reservation that a guest booked in September 2024 would not appear here, because it wasn't on the books yet at this point last year.
Last Year Final Revenue / Units Sold
- Total net revenue (or units sold) achieved across all of the prior year, including bookings made at any point — even late in the season.
Why it matters: This is the complete picture of what last year actually delivered. It's useful as a full-year benchmark and to understand the "late booking tail" — the difference between this metric and Same Time Last Year shows how much additional revenue came in during the back half of the booking window.
Example: For June 2024 campsite revenue, this includes every booking that applied to June 2024 nights, regardless of whether it was booked in January 2024 or in June 2024 itself.
Current Revenue / Units Sold
- Your current year's net revenue to-date plus all revenue already on the books for future months this year.
Why it matters: This is your real-time position for the current year. It combines actual, already-earned revenue for months that have passed with committed (on-the-books) revenue for upcoming months. It answers: "What is our current running total for the year, including what's already reserved?"
Example: In May 2025, this metric for August 2025 campsite revenue reflects all reservations for August nights that are currently confirmed — whether booked in January or last week. For February 2025 (a past month), it reflects actual earned revenue.
Target Revenue / Units Sold
- The revenue or units sold goal you set for a given month and revenue category in the Performance Planner.
Why it matters: This is the benchmark you chose at planning time. Comparing Current against Target tells you whether you're ahead, behind, or on pace against your own plan. Comparing Same Time Last Year against Target helps you gauge whether your goal represents growth over your prior-year pace.
Example: If you set a target of $50,000 for August 2025 campsite revenue and your Current As-of Now revenue for August is $38,000, you're at 76% of target with several months still to book.
How to Use These Metrics Together:
The power of this view is in reading the four metrics side by side:| Scenario | What it Suggests |
| Current ≥ Target | You're on track or ahead of plan |
| Current < Same Time LY | You're pacing behind last year at this stage — worth investigating |
| Current > Same Time LY but < Target |
You set an ambitious growth target; gap may close as late bookings come in |
| Last Year Final > Same Time LY |
Your park has a strong late-booking pattern — Current As-of Now will likely grow significantly as the season approaches |
| Target < Last Year Final | Your target is conservative relative to what you actually achieved last year |
Filters and Dimensions Available:
| Field | Description |
| Month |
Filter to a specific month, quarter, or year |
| Revenue Category | Campsite, Add-on, Point of Sale, or Fees |
| Category Name | Subcategory (e.g., RV, Tent, Lodging for campsites) |
| Type Name | Specific campsite type, add-on type, or POS location name |
| Is Type Active? | Whether the campsite/add-on type is currently active in your system |
Additional Information:
- Date range: The dashboard covers the prior calendar year, current calendar year, and next calendar year. Months outside this window will not appear.
-
Revenue is calculated on an accrual basis—recognized by stay date—so your budgets always reflect when guests are actually on-site, not when payments hit your account.
- All figures are net: Revenue reflects charges minus applicable discounts. Voided charges are excluded.
- Missing targets display as $0: Any month or category without an uploaded target will show $0 for the Target metric.
- Data refreshes daily: The dashboard rebuilds once per day. Figures reflect bookings as of the previous day.
Frequently Asked Questions
Q: Can I group targets by Category instead of by Site Type?
Yes, The template includes a row for each site type, but you are not required to fill in every row. To budget at the category level, select one site type within that category, enter your full category budget in that row, and delete the remaining rows. The dashboard aggregates by category name, so the totals will display correctly.
Q: What happens if I upload a duplicate row?
If you upload a row with the same park ID, category, type, and month as an existing entry, Performance Planner will use the most recently imported or edited value.
Q: Why aren't my new targets showing up in the dashboard?
As soon as the Monitoring tab in Performance Planner confirms a success, the data is viewable in Analytics. If the data appears stale, a hard refresh using Clear cache and refresh in the dashboard menu may be needed.
Q: Can I track just revenue targets, or do I need to enter unit targets too?
You can fill in either or both the Target Revenue and Target Units Sold columns — neither is required. Only enter what is relevant to how your park tracks performance.
Q: What happens if I enter an invalid Type ID?
The data uploaded is validated to ensure the Type IDs match what is in Campspot Analytics. An error message will appear if there is an issue with the data validation.