.png?width=200&height=150&name=campspotlogo2019%20(1).png)
Dashboard: YoY Metric Comparison
Summary
This dashboard provides campgrounds with an overview of their business health year-over-year. Some of the key highlights of this dashboard are as follows:
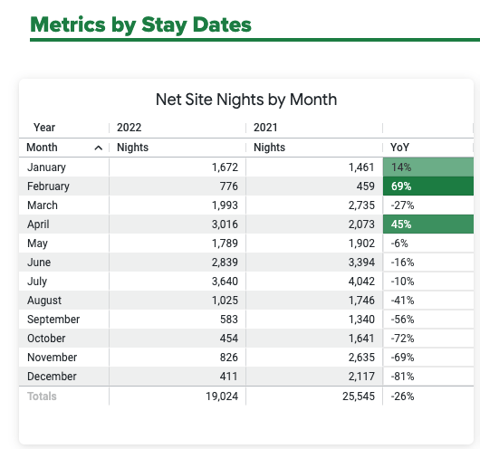
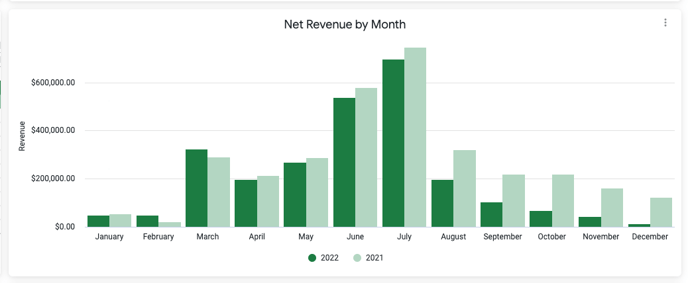
- Key metrics covered on this dashboard are: Occupancy, Site nights, Revenue, ADR and RevPAR. If you have questions about any of the terminology used on this Dashboard, visit this Terminology link from Campspot Analytics.
- All data on this dashboard is end of the month reporting used to see how your campground performed against the previous year.
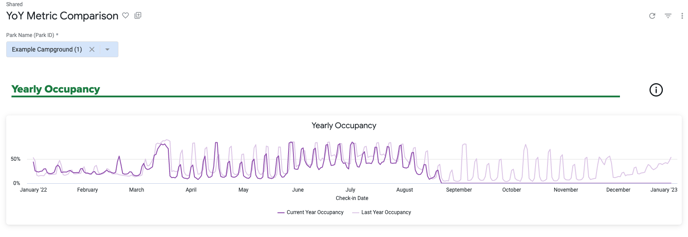
- This dashboard allows you to quickly see past or upcoming occupancy.
- Dates for both the current and previous year can be viewed.
- All data provided is net data. This means that cancellations have been removed so the data is comparing what is currently reserved now compared to the total for last year.
- All sites are based on the reservation start date. Other reports available in Campspot may be based on reservations occurring over a specified date range and may not organize data by reservation start date.
Example: If your park has a 20 night reservation starting on August 31st, this dashboard will allocate all 20 nights to the month of August instead of spreading the nights over the duration of the reservation.
Note: If you prefer to see this same data not grouped by reservation start date as described above, the YoY Metric Comparison (Stay-Through) dashboard will provide that information.
- The images below show an example of what some of this Dashboard looks like:
YoY Metric Comparison Dashboard FAQ:
Q: Why are the numbers different than other production reports?
A: The main difference is caused by how the data is presented. In this report, all metrics are aggregated in the month of the reservation start date. As mentioned in the example above, reservation nights are all counted in the month that the reservation starts in even if the reservation spans multiple months.
Q: What is RevPAR?
A: Revenue Per Available Room. A typical measure in the hospitality industry. RevPAR is calculated by multiplying your Average Daily Rate (ADR) with your Occupancy percentage.