.png?width=200&height=150&name=campspotlogo2019%20(1).png)
To learn Campspot Analytics and how to access and login to it visit our feature introduction support article here.
Dashboard: POS - Sales Insights
Summary
This dashboard provides an overview of the products sold via your Campspot Point of Sale for a defined period of time. Some of the key highlights of this dashboard are as follows:
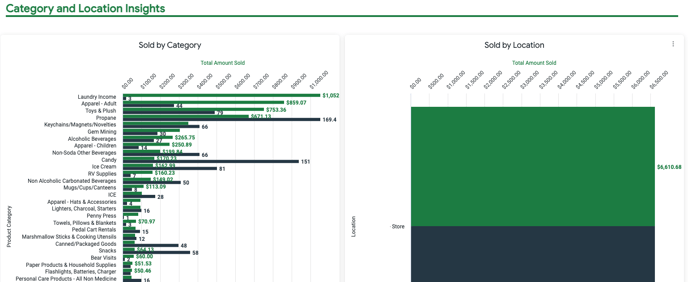
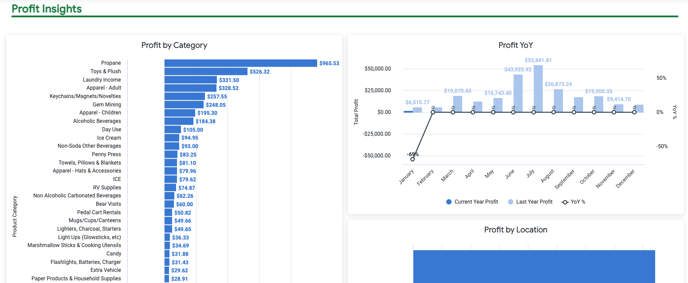
- Key metrics covered on this dashboard are Total Quantity Sold, Total Amount Sold, Total Profit, Top 15 Items by Profit Margin, Sold by Day, Sold by Hour of the Day, Sold by Category, Sold by Location, Profit by Category, Profit YoY, Profit by Location,
- This dashboard can be filtered by date range at the top. Changing the date range will update all tiles apart from the last tile 'Profit YoY' which will always compare the current year and the last year.
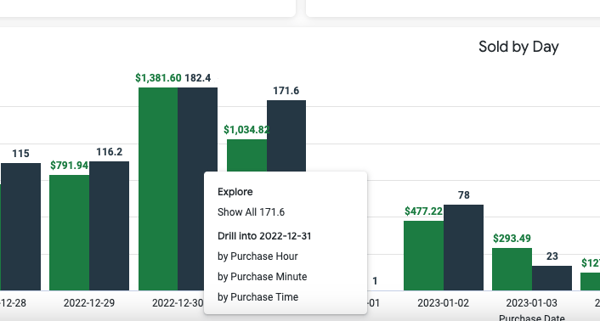
- Clicking on tiles or charts on the dashboard allows you to drill down and see the specific data that makes up the numbers shown. Note: not all tiles or charts can be clicked to drill down.
- The green POS Exports button at the top right brings up various POS Sales related reports that can be downloaded. The available reports are as follows:
Note: Campspot Analytics only returns a maximum of 5000 rows per report in the browser interface. A warning label will appear if more than 5000 rows return. To see all results, please download the report in an excel or csv format using the gear icon menu and selecting Download > Limit > All Results.
The clip below shows the process of accessing these reports.
- The measure definitions of this dashboard are as follows:
Measure
Definition
Total Amount Sold
Quantity Sold x Sold Price
Total Default Cost
Quantity Sold x Cost per Unit
Total Profit
Total Amount Sold - Total Default Cost
Location
Store location
Total
Quantity Sold x Sold Price + Tax
Sub Total
Quantity Sold x Price (either Sold Price if there is a discount or Retail Price if there is not one)
Discount
Quantity Sold x (Retail Price - Sold Price)
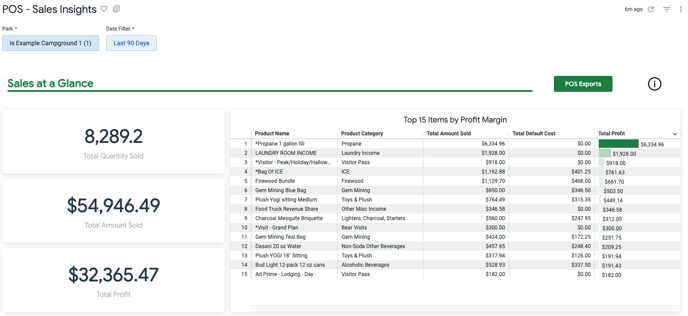
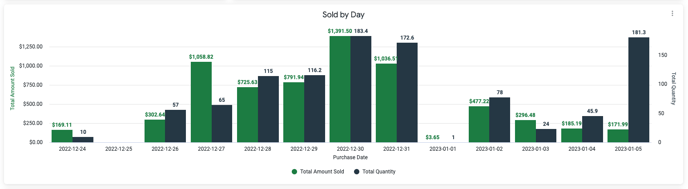
- The images below show an example of this dashboard:
POS - Sales Insights FAQ
Q: Why is my default cost always $0 and my profit the same as my sales?
A: In order to see a possible profit calculation on this dashboard you will need to set a cost per unit in the POS for each product. The system takes into consideration the cost of each unit sold vs the sell price in order to determine a profit measure.
Note: Cost per unit needs to be set for each product prior to the item being sold. If you have discovered that your is set at $0 and you then make updates, the data on this dashboard will not retroactively change to reflect the updates
Q: Are the reports available through the POS Export button the same as the reports that are available in Campspot?
A: Yes, these reports provide the same information and are the same. There are now multiple ways to access them with the addition of the export button on this dashboard.
Q: What is the difference between Total Amount Sold and Total Quantity?
A: The total amount sold is the quantity sold multiplied by the selling price and the total quantity sold is only the number of items sold.