.png?width=200&height=150&name=campspotlogo2019%20(1).png)
Dashboard: Portfolio Overview
Summary
This Dashboard provides an overview at the organization level of what is happening across your park's portfolio. Please note: if you do not own multiple parks, this dashboard will only show data from the park that you do own. This report is best used by organizations that own or operate multiple parks.
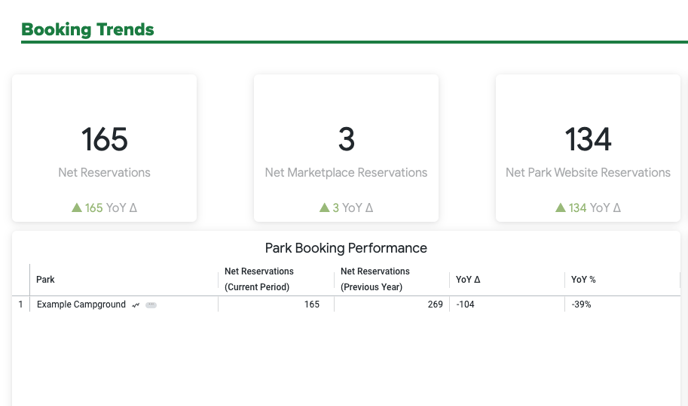
- The dashboard summarizes booking trends on a net basis.
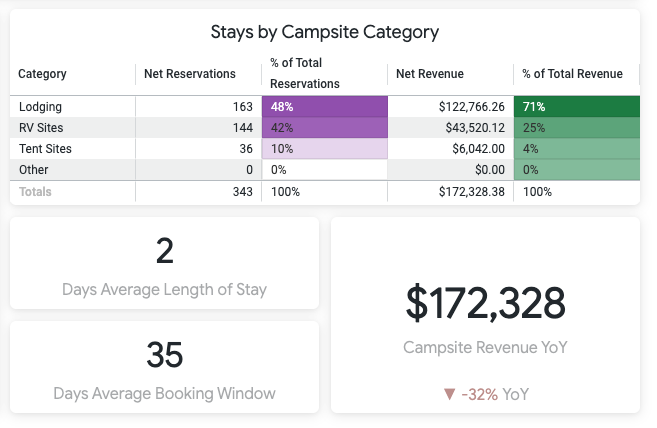
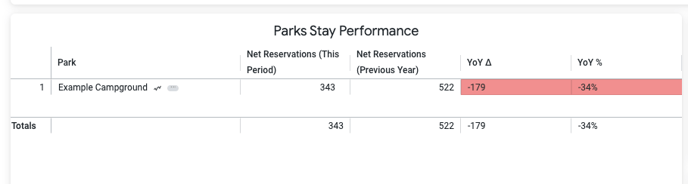
- This dashboard provides data on when reservations were booked as well as when the stay occurred.
- Overall performance of your properties is provided as well as some level of granularity into what is performing well and what is not.
- The trend line icon next to the park name links to the Park Overview Dashboard which provides more insight into specifics about the performance of a park.
- If you have questions about any of the terminology used on this Dashboard, visit this Terminology link from Campspot Analytics.
- The images below show some examples of this Dashboard:
Portfolio Overview Dashboard FAQ:
Q: Why is there no park filter?
A: This dashboard is meant to help multi-park owners understand their overall business. As a single-park user, this report might not be as useful as using the Park Overview Dashboard.
Q: Why do I see two different date filters?
A: One date filter is used to modify the Booking Trends section of the dashboard, and the other is used to modify the Stay Trends section.
Q: What is the difference between Booking Trends and Stay Trends?
A: Booking Trends look at when a reservation was booked while the Stay Trends look at when a stay occurred.