.png?width=200&height=150&name=campspotlogo2019%20(1).png)
Dashboard: Park Overview
Summary
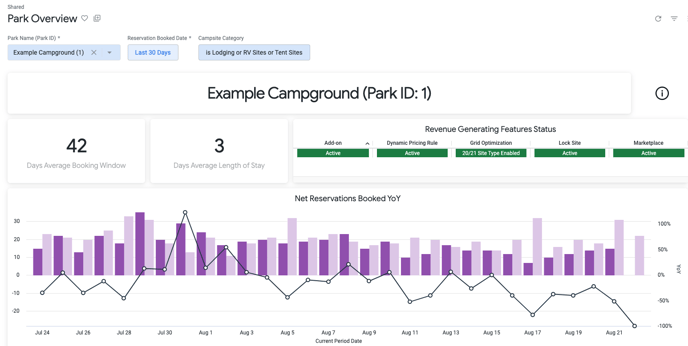
This Dashboard aims to provide you with an overview of recent booking trends and active feature statuses. This Dashboard is accessed in the same way as all other Dashboard but is also accessible via a trend line click on the Portfolio Health dashboard. Some of the Dashboard highlights are as follows:
- Easily view which unique Campspot features are active at your park
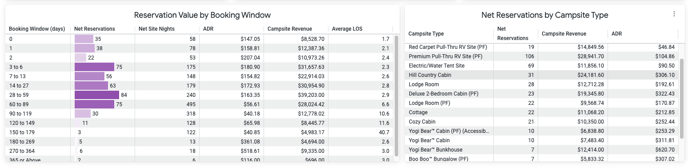
- Analyze which booking windows are popular and what kind of ADR is being sold. This can be an indicator of where prices could be increased to maximize revenue or decreased to drive more business.
- The Booked Date filter will show dates when reservations were booked. Updating this filter updates all the tiles within the report to show data from that specific timeframe. This filter automatically defaults to the last 30 days.
- Easily compare reservations booked this year vs reservations booked for the same date range on the previous year. This can be seen in the Net Reservations Booked YoY section.
- All data provided is net data. This means that cancellations have been removed so the data is comparing what is currently reserved now compared to the total for last year.
- The Campsite Category filter automatically defaults to excluding the 'other' Site Type Category. If you prefer to include this in your dashboard view you should change the filter prior to loading the dashboard data.
- If you have questions about any of the terminology used on this Dashboard, visit this Terminology link from Campspot Analytics.
- The images below show an example of this Dashboard.
Park Overview Dashboard FAQ:
Q: What is the most valuable information I can get out of this Dashboard?
A: All of the information provided on this Dashboard can be valuable to parks for various reasons, however, the main goal of the Dashboard is to give you insight trends for this year compared to last year. This will help you determine how you park can improve and can also show you which unique features may be underutilized at your park.