.png?width=200&height=150&name=campspotlogo2019%20(1).png)
To learn how to access Campspot Analytics and how to access and login to it visit our feature introduction support article here.
Dashboard: Campsite Cancellation Insights
Summary
This dashboard provides campgrounds with valuable insights about their cancellation trends. Some of the key highlights of this dashboard are as follows:
- Key metrics covered on this dashboard are revenue lost per cancellation, how close to arrival guests typically cancel, what percent of cancellations come from the campground's consumer booking site versus the Campspot marketplace.
- The data on this dashboard is split into two sections; Cancellation Insight by Cancellation Date and Cancellation Insights by Reservation Start Date.
- This dashboard can be filtered by date range at the top of the dashboard. Changing the date range will update all tiles apart from the last tile 'Cancellation Ratio YoY' which will always show the current year and the last year.
- Clicking on tiles or charts on the dashboard allows you to drill down and see the specific data that makes up the numbers shown. The clip below shows an example of this on the Cancellation Ratio by Reservation Start Month chart.
Dive in to this report:
- Click here to view the Cancellation Insights Report.
.gif?width=600&height=321&name=ezgif.com-gif-maker%20(92).gif)
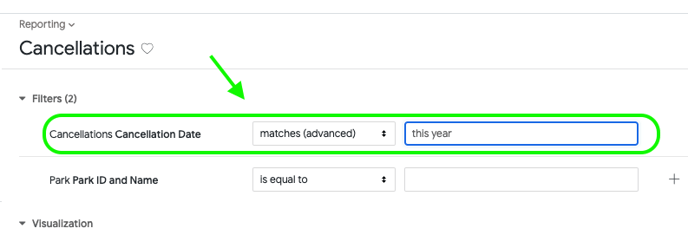
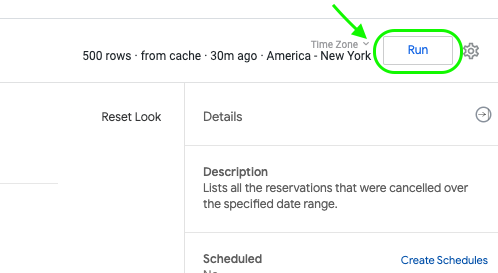
- Through the Export Data button towards the top right corner of the screen you can access a list of all cancellations that have taken place over the specified date range. On the Export Data screen, enter the date range and then click the Run button at the top right corner of the screen. The three images below show these steps.
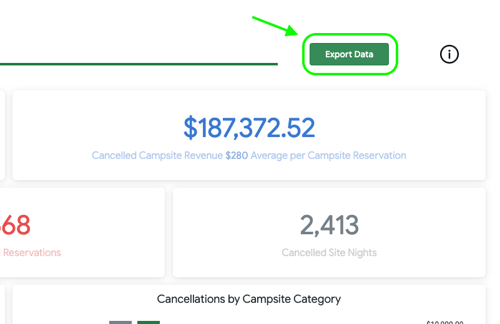
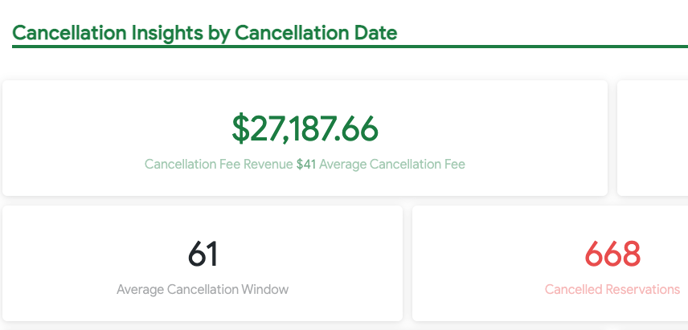
- The images below show an example of what some of the Campsite Cancellation Insights Dashboard looks like:
Campsite Cancellation Insights Dashboard FAQ:
Q: How can I see if a dip in my revenue correlates with the number of cancellations for the same time frame?
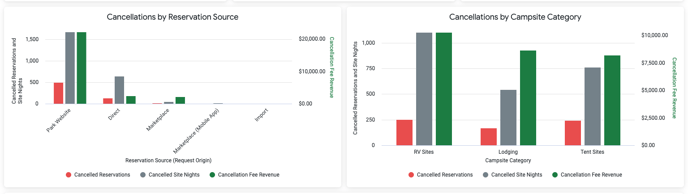
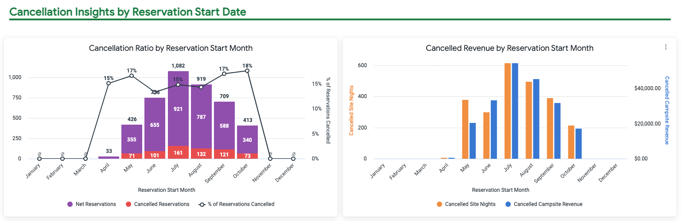
A: To find this information you should first update the date range to match the date range that your are seeing a dip in revenue or make sure that date range is already shown. After updating the date range you should view the Cancellations by Campsite Category chart, the Cancelled Revenue by Reservation Start Month chart or the Cancelled Revenue by Reservation Start Month chart to see cancellation data for that time.
Q: What does Cancelled Campsite Revenue or Cancelled Revenue mean?
A: This is the sum of how much would have been charged for the cancelled reservations had they actualized. This number is exclusive of taxes and any fees. For revenue made from cancellation fees, see Cancellation Fee revenue.
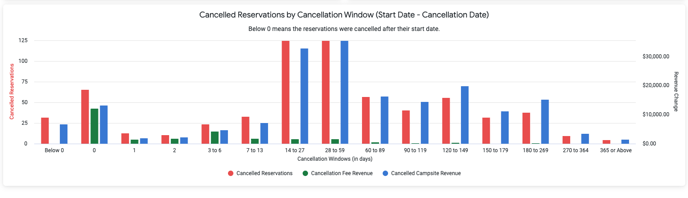
Q: What is the cancellation window defined as?
A: Cancellation widow is the number of days between the cancelled date and the start date of a reservation. Example: If a reservation was made on December 10th for a start date of December 25th and was cancelled on December 20th, the cancellation window is five days (25th-20th).
Q: What are definitions of the different sources show for Reservation Source (Request Origin)?
A:
Park Website: Reservations made through your park's consumer booking site
Direct: Reservations made through the Campspot Admin Site by your park staff
Marketplace: Reservations made through Campspot.com
Marketplace (mobile App): Reservations made through the mobile app for Campspot.com
Import: Reservations imported when you onboarded with Campspot